answer 3:2 - Hill's plot
As we know from preceding tutorials, the Hill's plot severely distorts the distribution of the experimental error, and is unreliable outside the range 0.1 < Y < 0.9 (or -1 < log Y/(1-Y) < 1). However, within its central range (-1 < log(Y / 1-Y) < 1) the Hill plot yields a reasonable linearization of the experimental data. As shown in the figure below, the Hill coefficient for this data set is n=1.43.
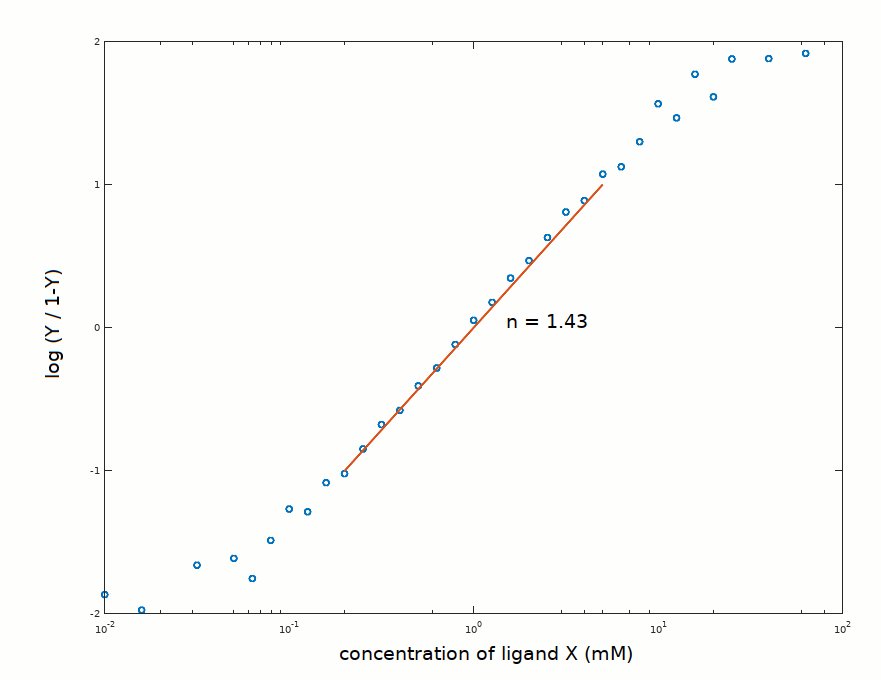
A Hill coefficient greater than n=1 is indicative of positive (homotropic) cooperativity; thus the above analysis suggests: (i) that the protein is a oligomer, made up of at least two subunits; and (ii) that the protein presents positive cooperativity.
Proceed to the analysis using a cooperative ligand binding scheme.
Back one step.